
RVNU #039: University Endowments Are Under Pressure
The Startup Game is Fundamentally Shifting as Result

It wasn’t until Toby Coppel, our lead investor at Guidebook asked me to present to Mosaic’s LPs that I truly appreciated the influence of universities on the venture capital ecosystem. The room was packed with people from top universities looking to Toby and his team for alpha on the next wave of tech.
Most founders don't realize that universities are the primary source of VC funding. When you pitch a Sand Hill Road VC, you're effectively pitching Yale's endowment manager, or Harvard's, or Stanford's or Oxford’s.
Universities Fund the VC Ecosystem
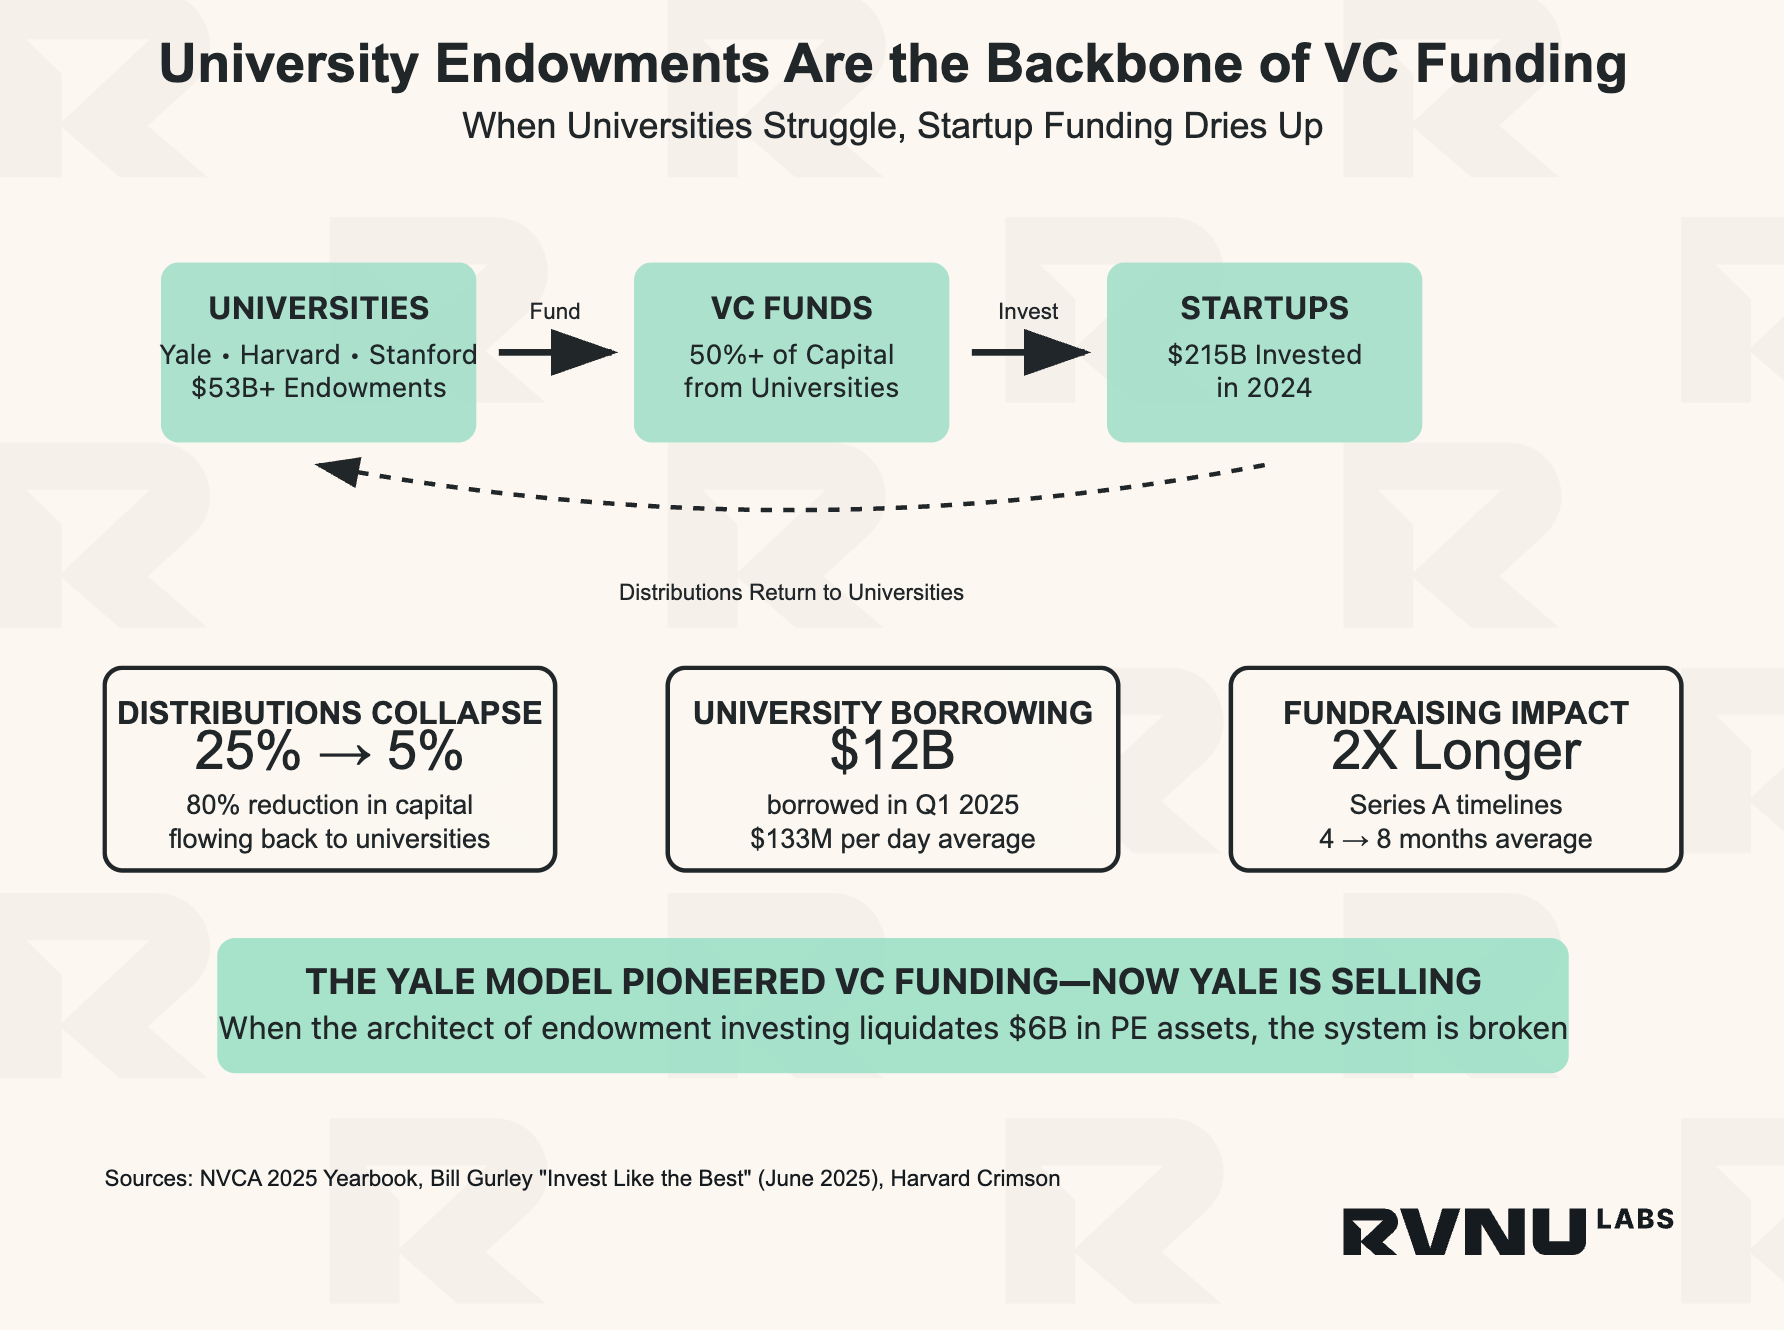
Yale's endowment strategy of allocating 50%+ to venture and private equity became the standard template that most major institutions adopted. This model worked well when exits were frequent and distributions flowed back to universities for reinvestment.
That system is now under stress.
Current Distribution Data
LP Distribution Changes:
Historical average: 25% of VC fund value distributed annually to LPs [1]
Current reality: 5.1% annual distributions [2]
Result: 80% reduction in available reinvestment capital
University Financial Stress:
Q1 2025: $12B borrowed by US universities [3]
Daily average: $133M in new debt
Harvard: Issuing $1.2B in bonds this fiscal year [4]
Yale: Liquidating $6B in private equity assets [3]
💡 SIDEBAR: Why This Matters
When startups exit, VCs return money to their LPs (Limited Partners) as "distributions." These LPs—mostly universities and pension funds—then reinvest this money in new VC funds. When distributions drop 80%, the entire funding pipeline chokes. It's basic math: less money in = less money out.
Impact on Your Startup
1. Longer Fundraising Timelines
Series A rounds that previously closed in 3-4 months now take 6-9 months. This requires building 18-month cash runway scenarios instead of 12-month ones. Pipeline coverage needs a 2X buffer due to extended timelines.
2. Higher Efficiency Requirements
VCs now require metrics that were previously considered strong performance:
CAC Payback: <18 months (down from 24-36 months)
LTV/CAC Ratio: >5X (up from 3X)
Net Revenue Retention: >120% (110% was previously acceptable)
Revenue per Employee: Top quartile for your stage/sector
💡 SIDEBAR: CAC Payback Reality Check
Customer Acquisition Cost (CAC) Payback is how long it takes to recover your sales and marketing investment. Spend $10K to acquire a customer paying $1K monthly? That's a 10-month payback. Anything over 18 months is now considered toxic.
3. Geographic Differences
Tier 1 Markets (SF/NYC/Boston):
Funding timelines: 6-9 months
Multiple offers still possible for strong companies
Higher valuations for top performers
Tier 2/3 Markets (Austin/Denver/Remote):
Funding timelines: 9-12 months
Single-offer scenarios more common
20-30% lower valuations vs. Tier 1
Series A Fundraising Reality
Here's the updated math for a $2M ARR SaaS company raising Series A:
Historical Environment (2021):
Timeline: 4 months
Success probability: 70% [5]
Valuation multiple: 12X ARR = $24M
Funding amount: $8M
Current Environment (2025):
Timeline: 8 months [1]
Success probability: 35% [5]
Valuation multiple: 6X ARR = $12M
Funding amount: $5M
Revenue Team Impact:
Longer fundraising cycles require extended runway planning
Higher efficiency requirements across all metrics
Lower valuations mean higher dilution
Alternative: Private Equity for Bootstrapped Companies
If you're pre-Series A and bootstrapped, Private Equity presents an option many founders overlook. PE firms are interested in profitable, growing SaaS companies and often provide:
Lower dilution than VC funding
Faster decision processes
Focus on profitability over growth-at-all-costs
Less geographic bias
Performance Requirements
These metrics are now required rather than preferred:
Core Metrics:
Monthly Recurring Revenue (MRR) Growth: >15% monthly
Sales Efficiency (New ARR/Sales Investment): >1.5X
Pipeline Velocity: <90-day average sales cycle
Customer Concentration: <10% revenue from single customer
💡 SIDEBAR: Sales Efficiency Math
Sales Efficiency = Net New ARR / Sales & Marketing Investment. If you invest $1M in sales/marketing and generate $1.5M in new annual recurring revenue, that's 1.5X efficiency. Below 1X means you're spending more than you're generating.
Companies that miss these benchmarks will find fundraising difficult.
Founder Strategy Framework
Phase 1: Efficiency Focus (Months 1-6)
Achieve top-quartile unit economics
Build 18-month cash runway
Document revenue processes
Phase 2: Relationship Building (Months 6-12)
Connect with VCs before needing funding
Build strategic partnerships
Consider PE relationships if profitable
Phase 3: Multiple Options (Months 12+)
Traditional VC funding (if metrics support it)
Revenue-based financing
Strategic acquisition discussions
PE growth capital (if profitable)
Summary
The LP liquidity reduction is changing startup fundraising. Universities provide the foundation for VC funding, and their current financial stress is contracting the ecosystem.
This requires:
Strong unit economics from the start
Extended timeline planning
Geographic awareness of capital concentration
Alternative funding relationships
Companies that optimize for capital efficiency will navigate this environment successfully. Those that don't will find fewer funding options available.
Want help navigating these choppy waters? RVNU specializes in helping founders navigate growth chaos successfully. Get your free $20M Roadmap to see how sustainable growth strategies can help navigate these challenging times.
Onwards,
Wayne
Founder & CEO, RVNU
Sources:
[1] NVCA 2025 Yearbook & Q4 2024 PitchBook-NVCA Venture Monitor
[2] PitchBook analysis, July 2024: "Distributions amounted to 5.1% of the net asset value overseen by US VC firms last year, down from over 30% in 2021"
[3] Bill Gurley, "Invest Like the Best" Podcast (June 2025): "In the first quarter of 2025, U.S. universities issued $12 billion in bonds, the third-highest quarter in history... Yale announced it would sell $6 billion in private equity assets"
[4] Harvard Crimson, April 2025: "Harvard University will issue $750 million in taxable bonds this month, bringing the total offering this fiscal year to $1.2 billion"
[5] Industry data from Juniper Square VC analysis, January 2025