Hey folks,
A number of you have been asking for a primer on go-to-market (GTM) debt, so we threw in an extra newsletter this week. Any questions on GTM debt or its related properties, jump in the chat, or drop us a note - however, it’s always a more fun and interesting conversation when you’ve completed your assessment, so when you get a spare 20 minutes, get comfortable and complete the assessment by clicking here.
Onwards,
Team RVNU
Executive Summary
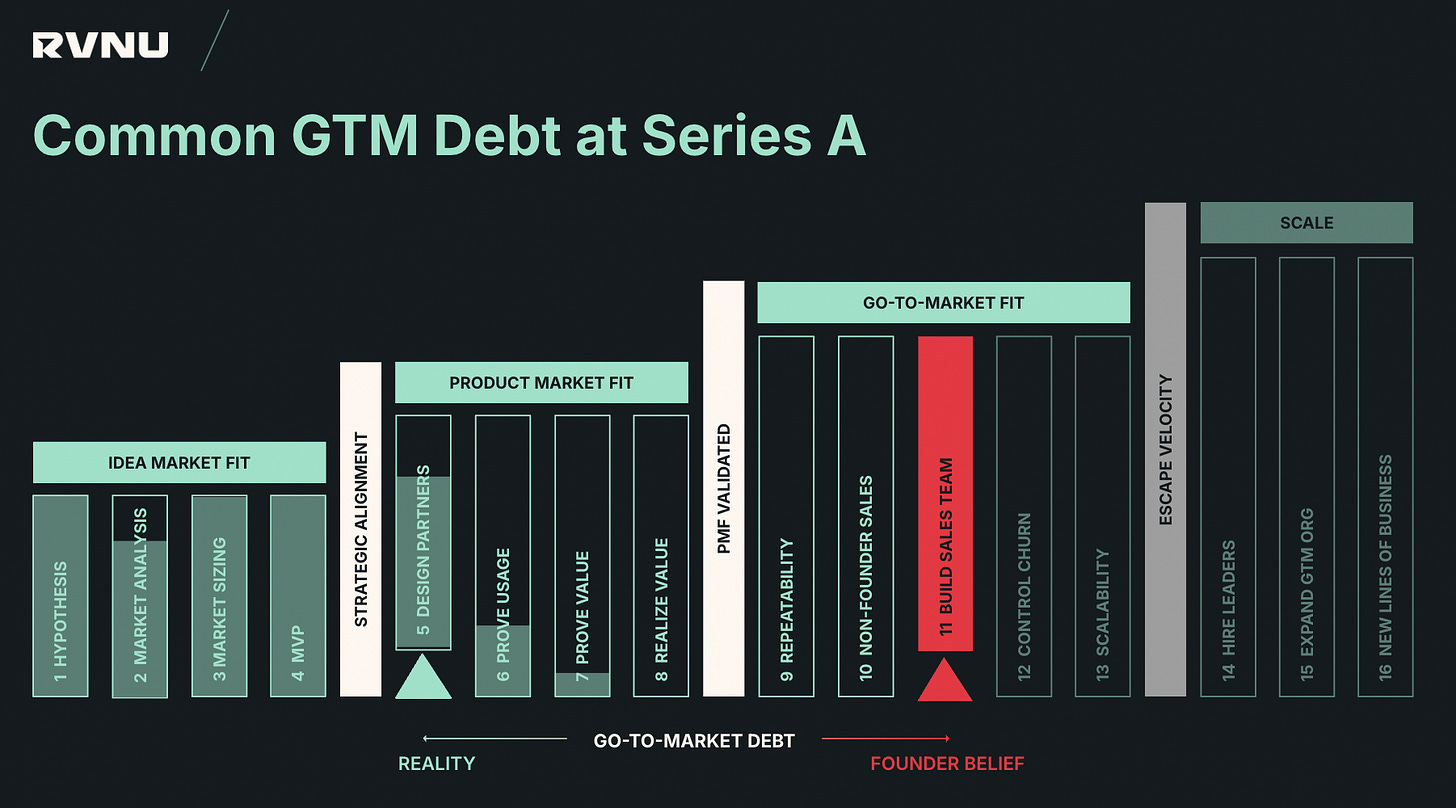
GTM Debt, a term our founder Wayne Morris coined in 2021, is the measurable gap between where your SaaS company operates versus where it should be in RVNU's 16-stage growth framework. This misalignment creates compounding inefficiencies that prevent sustainable revenue scaling.
Research shows: 74% of high-growth startups fail due to premature scaling ^1, and our opinion is that GTM Debt is a key mechanism driving this failure in the $1M-$20M ARR segment.
Technical Definition
GTM Debt accumulates when companies advance through growth stages without completing the prerequisite exit criteria, creating operational inefficiencies across:
Capital allocation (wrong spend at wrong time)
Team scaling (hiring before readiness)
Revenue optimization (scaling without repeatability)
The RVNU Framework: 4 Phases, 16 Stages
Phase 1: Idea Market Fit - Foundation validation
Phase 2: Product-Market Fit - Value demonstration
Phase 3: Go-to-Market Fit - Scalable growth systems
Phase 4: Scale - Infrastructure for $100M ARR
Common GTM Debt Patterns
Product-Market Fit Debt
Research Finding: Inconsistent startups monetize 0.5 to 3x fewer customers early on ^2
Example: Scaling sales before achieving documented $ value with 10+ clients (RVNU's Prove Value stage requirement)
Go-to-Market Fit Debt
Research Finding: Premature scalers have team sizes 3x larger than consistent startups ^3
Example: Hiring sales teams before proving non-founder sales success (RVNU's Non-Founder Sales stage)
Scale Phase Debt
Research Finding: Companies need 3x+ LTV:CAC ratios for efficient growth^4
Example: Pursuing $100M ARR without specialized GTM leadership and documented performance standards
The Cost of GTM Debt
No startup that scaled prematurely passed 100,000 users^5
93% never exceeded $100K monthly revenue^6
Proper scalers grow 20x faster than premature scalers^7
Bottom Line: GTM Debt compounds exponentially - stage misalignment becomes increasingly expensive to resolve at scale.
Assessment & Resolution
RVNU's “$20M Roadmap” will assess your GTM Debt and diagnoses misalignment across all 16 stages through:
Stage Completion Analysis - Exit criteria validation
Capital Efficiency Review - LTV:CAC, payback periods, burn multiples
Anti-Pattern Detection - Negative signals disguised as progress
Prioritized Remediation - Highest-impact fixes sequenced for maximum ROI
Your Custom $20M Roadmap
Complete RVNU's 20-minute assessment to receive:
GTM Debt Score - Quantified misalignment across 16 stages
Benchmark Analysis - Performance vs. 100+ B2B SaaS companies
Prioritized Actions - Stage-specific remediation plan
Implementation Guidance - Complete path to revenue acceleration
Result: Many founders successfully implement recommendations independently, achieving measurable revenue growth within 90 days.
Next Steps
GTM Debt represents the difference between 20x growth and startup failure. RVNU's 16-stage framework provides the diagnostic precision needed to identify and resolve growth constraints before they compound.
Take Action: Get your custom $20M Roadmap and transform GTM Debt from a growth constraint into competitive advantage.
Identify your GTM debt and get prioritized actions for reaching escape velocity
Sources: RVNU proprietary 16-stage framework built from founding team’s 40+ years operating revenue at early-stage startups and validated against verifiable research including:
^1 Startup Genome Project: Analysis of 3,200 high-growth internet startups
^2 Startup Genome Report Extra: Premature Scaling
^3 Startup Genome Report Extra: Premature Scaling
^4 Andreessen Horowitz: "Why Do Investors Care So Much About LTV:CAC?"
^5 Startup Genome Project: Analysis of 3,200 high-growth internet startups
^6 Startup Genome Project: Analysis of 3,200 high-growth internet startups
^7 Startup Genome Project: Analysis of 3,200 high-growth internet startups
OpenView Partners SaaS Benchmarks (400+ private SaaS companies)
ChartMogul SaaS growth analysis


