
RVNU #015: Building Early Stage Metrics The Right Way
A starter guide for SaaS startups to move past vanity metrics into revenue insights


Introduction
As a CEO or Founder you are busy making product decisions, bringing on first clients, speaking at events, meeting with investors - I’m sure that last thing on your mind is how to capture data to turn into metrics for action - until you need it.
And of course, investor guidance or a quick internet search will help find ‘how to build’ what I call the mighty 5: Customer Acquisition Cost (CAC), Lifetime Time Value (LTV), Monthly Reoccuring Revenue (MRR), Churn Rate & Average Revenue Per User (ARPU). Variations of these metrics monitored across the business are essential to both the business and investors. However, stopping there is where the the problem starts.
Many have fallen into the trap of using ‘standard metrics’ as mere vanity reports. These metrics often lagging indicators, languish in isolated pivot tables, make sporadic appearances in monthly meetings, or serve as outdated dashboard snapshots that fail to provide actionable insights when they are truly needed. This reactive approach to metrics can leave businesses scrambling for meaningful insights at critical moments.
So what happens when you see CAC increasing for the 3rd month in a row, MRR staying flat or dipping and your board (or you as CEO) want to know WHY.
And how or where do you start to find those answers to create action for change?
The problem statement:
At RVNU, my expertise aligns with building ‘operational excellence’ for the founders and their start-ups we engage with. By far the number one priority ask is:
“I have all this data and I don’t know how to use it to drive action in the business”
During my almost 9 years at Tableau Software, 2.5 at a startup and 8 months working with client here at RVNU - its still evident that getting data into metrics that drive action is still the top hurdle.
I’m not surprised. There are internal teams, tools, platforms and even consulting companies dedicated to capturing, cleaning, building and analyzing - all things data and metrics. Tableau taught me that the starting point of using metrics is curiosity - well and proper data capture.
So listen up, if you are an early stage CEO/Founder curious for answers with data, here are my 5 steps on how I have built a data-driven culture in start-ups from the ground up.
Step 1: When to start building? (its sooner than you think)
I mentioned that most founders and early stage companies think its too early to hire someone or buy a tool to capture data - and then all of a sudden its a scramble to try to pull together ‘data’ reactively. I’ve been a part of too many ‘backfilling data’ projects, to know this. If you can calculate LTV, you are well past the time to start capturing funnel metrics.
Within these 4 phases and 16 stages of growth, the goldilocks start timing is when you enter phase 5 of Product Market Fit.
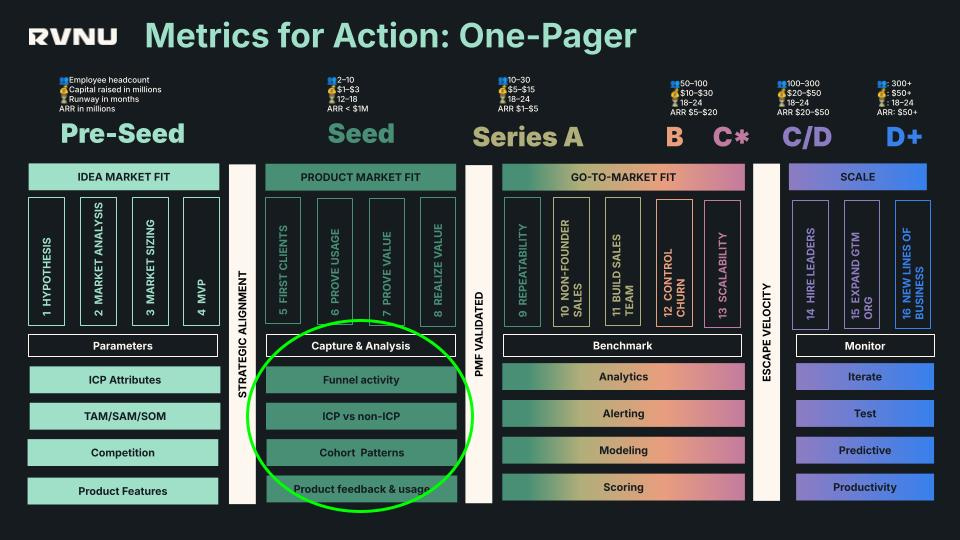
Fig 1: RVNU Metric maturity by Growth Stage
You already have external research from your Idea Market Fit: hypothesis, how big the market can be (setting early revenue targets), competition and who ideally is your best fit customer to identify the attributes to prove this right —or wrong and make pivots.
The start of building metrics can be classified into 4 categories:
Funnel metrics
ICP vs non-ICP
Product feedback & usage
Cohort Patterns
Note: What’s your GTM maturity? Take our free GTM self-assessment here to find your Go-to-market maturity within our RVNU SaaS growth framework.
Step 2: Build Funnel Metrics
Funnel metrics are leading indicators that help you bring context to a metric like CAC pinpoint additional insights that lead to taking future action. One exercise to start documenting what funnel metrics are right for your business is to map your customer journey: Awareness → Consideration → Purchase → Retention → Advocate. Metrics will help drive effective revenue at each milestone the buyer reaches in their decision to become and stay a customer.

As your early stage ‘funnel’ starts to take shape, its imperative that data capture starts to take shape 3 buckets: conversions, durations and revenue attributes.
Conversion: How much ‘interest’ is turning into revenue?
For conversions, you’ll need to tag & track volume or quantities of things like meetings, leads, opportunities and milestones/touch points across the funnel.
Example: Close Rate by ‘customer journey’ stage (28%)
Duration: How long does it take us to turn into revenue?
For durations, you’ll need to tag & track movement of things like meetings, leads, opportunities and milestones/touch points by enter & exit dates.
Example: Average Sale Cycle (45 days)
Revenue: Whats the amount of revenue captured and is it growing?
For revenue, you’ll need to tag & track revenue by usage, platform or user depending on your licensing model.
Example: Average Sale Price ($35k)
At a minimum if you can get to the following metrics above, you will be in a good place to start taking action. Working backward into revenue goals with these 3 metrics gives you an idea of what actions you need to take to ‘fill your funnel’ at having a chance in hitting ambitious revenue goals.
ProTip: Search free ‘Customer Journey’ template to start mapping your buyers journey through the funnel. RVNU has one that will be available with the Navigator product & community launching soon.
Step 3: Identify who is ICP vs non-ICP
Focusing on your Ideal Customer profile ICPs allows startups to allocate their limited resources more effectively through the funnel. Therefore, proper data tagging of ICP vs non-ICP in the funnel will give you an advantage. Why?
Targeting ICP customers through marketing who are most likely to convert
Qualifying ICP or (disqualifying non-ICP) in the sales process who are most likely to purchase
Regrettable or non-regrettable retention prioritization of who are most likely to find value and stay
To set this up, in a CRM you will need the ability to identify the target attributes that make up your ICP.
Examples of ICP attributes are: Geo Location, Industry, Employee Size, ARR, Capital Raised, Tech Stack compatibility, YoY growth, B2B
One you have those, you need to collect or pull those data points and tag accounts Those are usually pulled from inputs of fields collected from intake forms, validated as soon as they enter your funnel by 3rd party tools (like Clearbit, Zoominfo, LinkedIn or Clay) and re-enriched on a rolling 90-120 day cycle.
It could be as easy as manually checking an ‘ICP checkbox’ in the CRM or automating it with logic once the ICP values are met.

ProTip: Having these attributes tagged you can now start to use them for account scoring and prioritization which is helpful in the Go-to-market phase of metric maturity.
Step 4: Collecting product feedback and usage
When done well, product feedback and usage metrics allows you to improve features, stay competitive, and drive innovation with your MVP. This approach is crucial for customer retention and growth, as it helps solve issues, build trust, and identify bugs early, ultimately enhancing user satisfaction and reducing churn. Moreover, early feedback collection leads to cost and time efficiency by reducing development costs and accelerating time-to-market through quicker issue resolution and a streamlined software development lifecycle.
Most early stage product feedback comes in the form of conversations with customers. Having the discipline and ability to capture and use for action is what I’m talking about here.
Simple capture in CRM fields such as:
Features Requested (Multiple Drop Down) for roadmap discussion
Primary Use Case (Single list Drop Down) for targeted messaging
Features enabled for user adoption
Active usage (DAU/MAU) how often users engage with your product (stickiness)
Customer Satisfaction Score (CSAT): Measures how satisfied customers are with your product or specific features.
Net Promoter Score (NPS): Gauges customer loyalty and likelihood to recommend your product.
Automating the capture of these through tools like Amplitude, Gong, Canny, AppCues or G2 - will be a game changer, as you start to build analysis across funnel metrics, ICP and product usage.
Step 5: Understand metric cohorts
Last mention, but certainly not least is tracking metrics over time. Its extremely helpful, as you build these metrics, to see trends in cohorts. According to pitchdrive academy, cohort analysis is a favored method among venture capitalists for evaluating a startup's potential.
Demonstrate the startup's growth trajectory
Showcase improvements in key metrics over time
Provide a clear, data-driven overview of the company's progress
As a founder, using metric cohorts are similar to help drive shorter term action in the business - and the key is to understand which metrics should be in what time bound cohort.
Any of the metrics you initially start to look at in the funnel, ICP or product - tag them into cohorts of daily, weekly, monthly and quarterly on its rate of change. This will help you get to the proper time-bound formula/calculation and how often you monitor comparison trends.
Example: Sales Cycle (duration)
While you can take an plain average of your Sales Cycle over all time, knowing how Sales cycle is trending up or down monthly is even better. It helps you answer beyond how fast are we closing deals? to……Are we getting better at closing deals faster?
Therefore how you calculate the cohort would be: Total Sales for Cohort in Month X / Number of Customers in Cohort in Acquisition Month
Starting to compare metric trends by month takes careful mapping and standard formulas across the business, so no 2 people show up with inaccurate data causing confusion in meetings.
Conclusion:
There are no shortage of data and metrics that you CAN build, so the TL;DR of this is start now, know your buyer journey, start small in building metrics that ultimately test and prove your Idea Market Fit assumptions.
At the end of the day, the ultimate goal is to drive the most efficient revenue possible and without metrics - you won’t be able to get there. Period.
Challenge: If I get 20 likes on this, I’ll host a group session walking people through this in real time with Q&A.
Happy operating 👊🏼
Laura